Our analytics team has experience working with many analytics and data visualization tools, building complex models for our clients, and helping them make informed business decisions based on data. However, with several offerings, it can be a challenge to pick the right one for your business and data needs.
We took a deep look at Tableau, Power BI, and Google Data Studio. See the pros and cons of each below.
Tableau
Robust User Interface
One of the things that makes Tableau one of the most powerful visualization tools on the market is that there is a great deal of customization available to the user.
Each report begins as a blank slate. Once you import your data, you have two powerful tools at your disposal:
Calculated Fields
“Calculated fields allow you to create new data from data that already exists in your data source. When you create a calculated field, you are essentially creating a new field (or column) in your data source, the values or members of which are determined by a calculation that you control” as defined by Tableau.
- Calculated fields work in a similar way to those in Google Data Studio, PowerBI, and even Excel
- They allow you to create new fields based on your existing data
- The upside to calculated fields in Tableau is that based on what calculation you write out, Tableau will automatically group it as a dimension or a metric
- For example, if you are using text fields to map certain data to a paid media channel, Tableau will define your calculated field as a dimension
Parameters
“A parameter is a global placeholder value such as a number, date, or string that can replace a constant value in a calculation, filter, or reference line” as defined by Tableau.
- Parameters allow the user to create a dynamic field based on inputs and outputs of their choosing
- This flexible tool allows you to go beyond what’s available in Google Data Studio as you can use a parameter as a variable in calculated fields
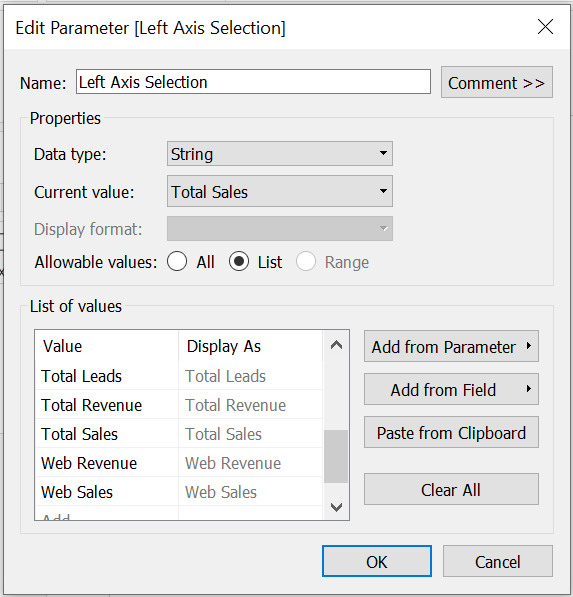
- For example, if you want a dynamic axis with different variables:
- You can create a parameter with all of your variables
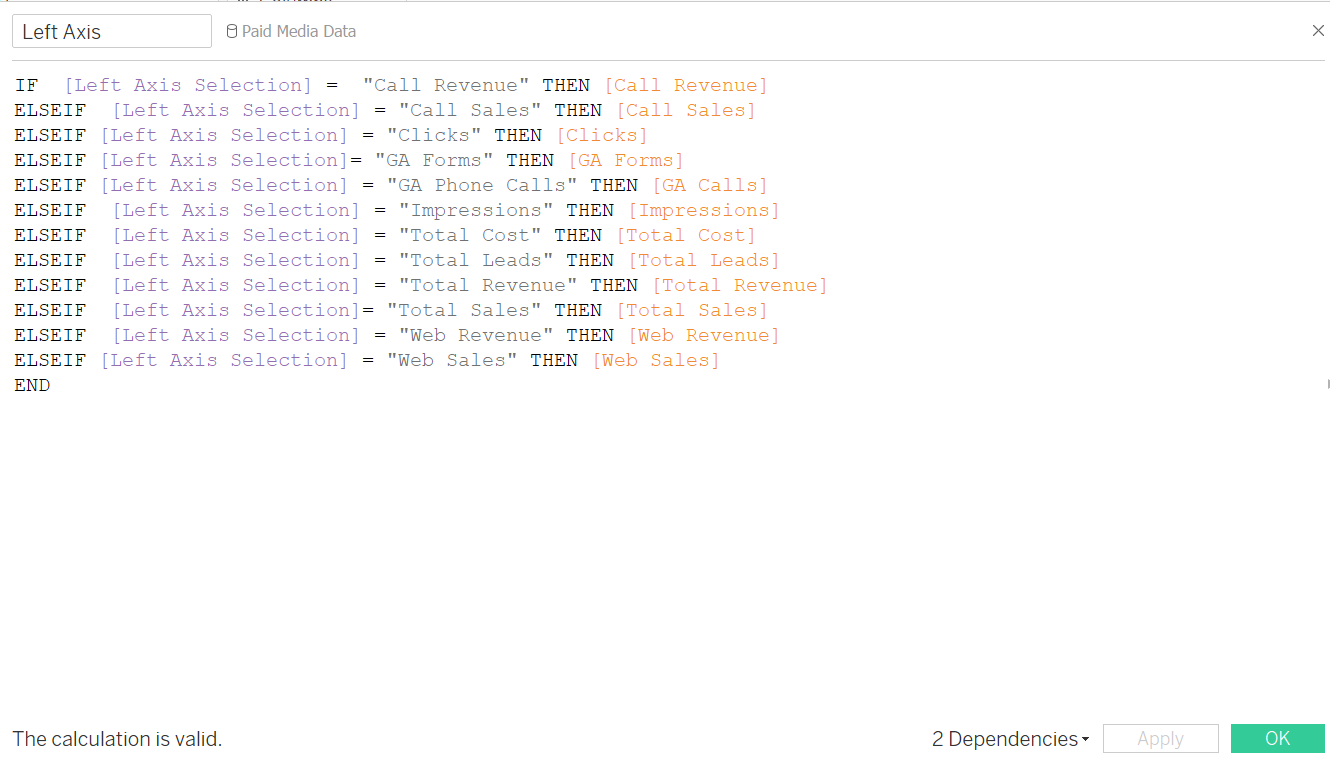
- Then use a calculated field that creates a metric which returns the variable selected by your parameter
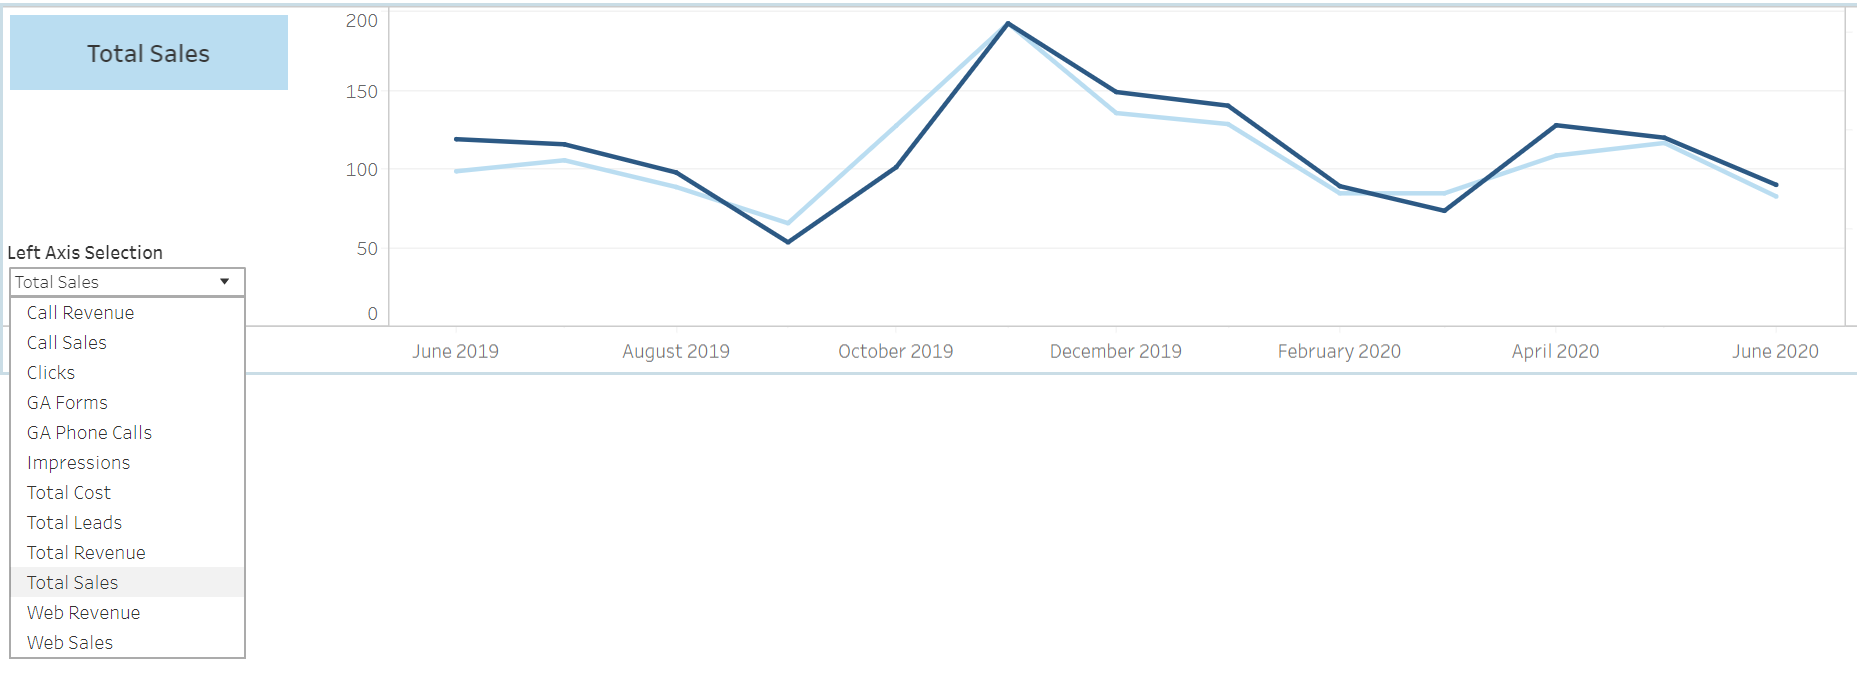
- Now, you have a dynamic variable that allows you to adjust your axis based on different variables
- You can create a parameter with all of your variables
Multitude of data connectors
Tableau supports connections to over 80 data sources. This wide variety of data sources increases the flexibility of the software.
Power BI
The familiarity of Microsoft products
Many people have used Microsoft products before, so the UI is familiar. Even if Word and Excel are the only Microsoft products users know, the display at the top of Power BI (PBI) is familiar.

Data Sources and Manipulation
There are dozens of different data connections available, including Excel, which makes it easy to connect existing data sources that likely already exist in an Excel file or CSV. Tools that let you manipulate data for complex analysis such as Power Pivot and Power Query are available in PBI, giving a great deal of flexibility to users who are familiar with these tools.
Visualizations
PBI has many formatting options that allow users to create precise and complex visualizations. Compared to Google Data Studio (GDS) it is very convenient that data in visualizations is live while you edit. (In GDS you have to toggle between “edit” and “view” in order to adjust visualizations and QA the data. PBI lets you do these actions at the same time, saving time).
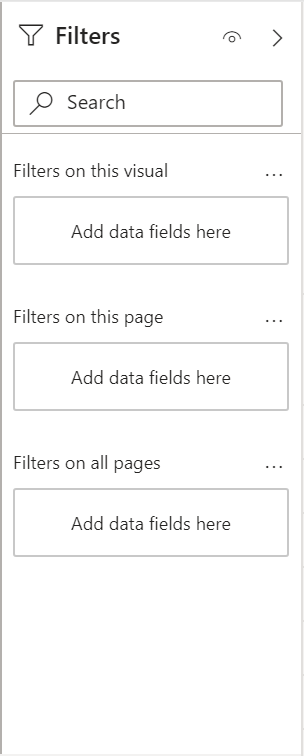
Filtering on visualizations is very simple as there are three categories that allow a high degree of control on the report: 1.) Filters on this visual 2.) Filters on this page 3.) Filters on all pages.
Complexity
If this is a user’s first attempt at data visualization, PBI can get complicated quickly. The filters, visualizations, and fields tabs are crowded and overwhelming at first glance. Additionally, if the user is not familiar with Power Query it can be difficult to manipulate data once imported into PBI.
PBI does have a lot of helpful resources online but if this is a user’s first time creating a dashboard, the simplicity of Google Data Studio may be a better choice.
Difficulty Sharing
Without upgrading to the premium version of PBI it can be difficult to share reports with coworkers that are using Mac devices. (Tools like PowerPortal can be a useful work around https://powerportal.io/)
DAX
Data Analysis Expressions (DAX) is a language created by Microsoft that allows users to take their current data sets and create new data using many formulas or expressions.
From the viewpoint of a user that is new to data visualization, it can be overwhelming to learn most elements of PBI, but it becomes an even bigger task when introducing DAX.
Power BI is recommended for intermediate to advanced users who have created data visualizations in the past. This tool provides a high level of customization to create precise reports but can become too complex for beginning users.
Google Data Studio
Ease of Use and Accessibility
Google Data Studio (GDS) is one of the most common reporting tools used within the industry partly because Google makes this tool accessible at free of cost. But GDS is also popular because, unlike Tableau, it’s an easier tool to learn unlike Tableau. With a few clicks you can create data visualizations and style the data accordingly.
Ongoing Tool Updates
Google continues to make updates to GDS to make the experience better. Although GDS is not as robust as PBI when it comes to data normalization capabilities, there are some updates that have made the tool more useful:
- Data Blending – GDS has a data blending capability that can be used for Data Joins and Data Unions. As with any join you would need to have a Join Key.
- Embedded data sources – This now makes it easier to share reports with others and not break the report because users might not have had the necessary access to the underlying data source.
- Selecting visualizations – You can now easily select all visualizations by type and make styling or data source updates without having to do one visualization at a time. This really is key when it comes to efficiencies.
The list of ongoing tool updates goes on and on and every so often new capabilities are added to make the tool even more useful. A great resource to stay up to date on what’s new with GDS is Google’s help center.
Limitation of Data Blending
When it comes to marketing, dealing with dozens of data sources is common practice. Although GDS data blending has been helpful for joining and unionizing data, the solution is not perfect.
As of right now you can only add five data sets to a Data Blend. In many instances this is not enough when trying to incorporate all marketing data sources within one visualization. For instance, if we are running media with seven different media partners and want to have a visualization showing the total number of impressions for the marketing campaign, using data blending would not be sufficient.
At REQ we are agnostic to reporting and BI technologies because we understand that brands and stakeholders might be accustomed to certain technologies and as a partner we adapt to their needs. We know that knowing the tech solution is not as important as understanding your marketing data and delivering the right data and insights to the stakeholder.